R_Lattice のバックアップ(No.13)
- バックアップ一覧
- 差分 を表示
- 現在との差分 を表示
- ソース を表示
- R_Lattice へ行く。
- 1 (2008-12-27 (土) 13:20:28)
- 2 (2008-12-27 (土) 13:30:43)
- 3 (2008-12-27 (土) 18:08:54)
- 4 (2008-12-30 (火) 16:12:02)
- 5 (2009-01-10 (土) 12:49:01)
- 6 (2009-01-10 (土) 18:17:20)
- 7 (2009-01-16 (金) 15:41:47)
- 8 (2009-01-17 (土) 15:58:41)
- 9 (2009-01-23 (金) 14:25:09)
- 10 (2009-01-29 (木) 18:05:34)
- 11 (2009-01-31 (土) 14:00:12)
- 12 (2009-02-05 (木) 18:17:47)
- 13 (2009-02-05 (木) 18:24:33)
- 14 (2009-02-09 (月) 16:34:56)
- 15 (2009-02-20 (金) 15:10:37)
- 16 (2009-02-20 (金) 18:28:13)
- 17 (2009-02-21 (土) 15:36:08)
- 18 (2009-05-25 (月) 12:49:19)
Lattice Multivariate Data Visualization with R 翻訳メモ
_ grid は Load されない?
> demo("labels", package = "lattice")
が動かない.
以下にエラー do.call("trellis.skeleton", c(list(formula = formula,
     cond = cond,  :
  関数 "textGrob" を見つけることができませんでした
gridパッケージで定義されている textGrob にアクセスできない. わざわざ
> library(gird)
と実行するか,あるいは
> file.show(system.file("demo/labels.R", package = "lattice"))
の
qq(gl(2, 100) ~ c(runif(100, min = -2, max = 2), rnorm(100)),
   xlab =
   textGrob(rep("Uniform", 2),
            x = unit(.5, "npc") + unit(c(.5, 0), "mm"),
            y = unit(.5, "npc") + unit(c(0, .5), "mm"),
            gp = gpar(col = c("black", "red"), cex = 3)),
   ylab =
   textGrob(rep("Normal", 2), rot = 90,
            x = unit(.5, "npc") + unit(c(.5, 0), "mm"),
            y = unit(.5, "npc") + unit(c(0, .5), "mm"),
            gp = gpar(col = c("black", "red"), cex = 3)),
   main = "Q-Q plot")
の textGrob,unit,gpar に grid:: を冠する必要がある. 確認すると
> search()
[1] ".GlobalEnv"        "package:stats"     "package:graphics"
[4] "package:grDevices" "package:utils"   "package:datasets"
[7] "package:methods"   "Autoloads"       "package:base"
> sessionInfo()
R version 2.8.1 (2008-12-22)
i686-pc-linux-gnu

attached base packages:
[1] stats  graphics  grDevices utils  datasets  methods  base
> library(lattice)
> sessionInfo()
R version 2.8.1 (2008-12-22)
i686-pc-linux-gnu
...
attached base packages:
[1] stats  graphics  grDevices utils  datasets  methods  base

other attached packages:
[1] lattice_0.17-17

loaded via a namespace (and not attached):
[1] grid_2.8.1
> search()
 [1] ".GlobalEnv"        "package:lattice"   "package:stats"
 [4] "package:graphics"  "package:grDevices" "package:utils"
 [7] "package:datasets"  "package:methods"   "Autoloads"
[10] "package:base"
と表示され,ロードはされているが,アタッチはされていない.
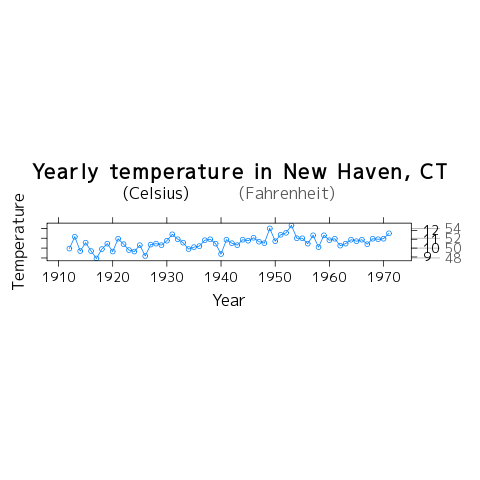
_ 異なる尺度を一つの軸に描くテクニック.
> axis.CF <- function(side, ...) {
   if (side == "right") {
       F2C <- function(f) 5 * (f - 32) / 9
       C2F <- function(c) 32 + 9 * c / 5
       ylim <- current.panel.limits()$ylim
       prettyF <- pretty(ylim)
       prettyC <- pretty(F2C(ylim))
       panel.axis(side = side, outside = TRUE, at = prettyF,
             tck = 5, line.col = "grey65", text.col = "grey35")
       panel.axis(side = side, outside = TRUE, at = C2F(prettyC),
                  labels = as.character(prettyC),
               tck = 1, line.col = "black", text.col = "black")
     }
     else axis.default(side = side, ...)
 }
> xyplot(nhtemp ~ time(nhtemp), aspect = "xy", type = "o",
      scales = list(y = list(alternating = 2, tck = c(1, 5))),
      axis = axis.CF, xlab = "Year", ylab = "Temperature",
      main = "Yearly temperature in New Haven, CT",
      key = list(text = list(c("(Celsius)", "(Fahrenheit)"),
                 col = c("black", "grey35")), columns = 2))
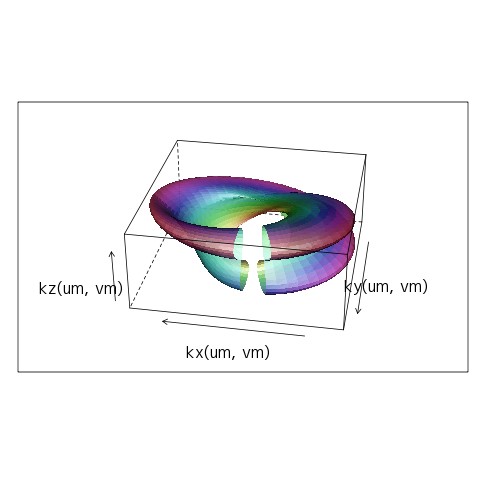
_ クラインの壺
kx <- function(u, v)
     cos(u) * (r + cos(u/2) * sin(t*v) - sin(u/2) * sin(2*t*v))
ky <- function(u, v)
     sin(u) * (r + cos(u/2) * sin(t*v) - sin(u/2) * sin(2*t*v))
kz <- function(u, v)
     sin(u/2) * sin(t*v) + cos(u/2) * sin(t*v)
n <- 50
u <- seq(0.3, 1.25, length = n) * 2 * pi
v <- seq(0, 1, length = n) * 2 * pi
um <- matrix(u, length(u), length(u))
vm <- matrix(v, length(v), length(v), byrow = TRUE)
r <- 2
t <- 1

wireframe(kz(um, vm) ~ kx(um, vm) + ky(um, vm),
    shade = TRUE, screen = list(z = 170, x = -60),
     alpha = 0.75, panel.aspect = 0.6, aspect = c(1, 0.4))
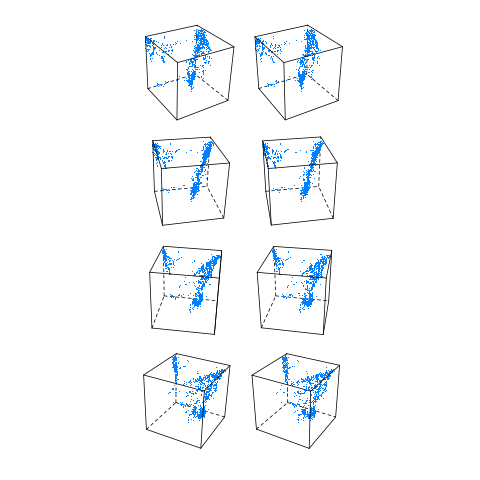
_ 立体画像?
ページの向こうに焦点を合わせるようにして,二つの列を重ね合わせると,奥行きが表現された画像を実感することができる?
_ cloud() 関数のデフォルト
の viewpoint. screen 引数にリストで指定する.
> cloud(iris[,1] ~ iris[,2] * iris[,3])
> X11()
> cloud(iris[,1] ~ iris[,2] * iris[,3],
    screen = list(z = 40, y = 0, x = -60),
     )
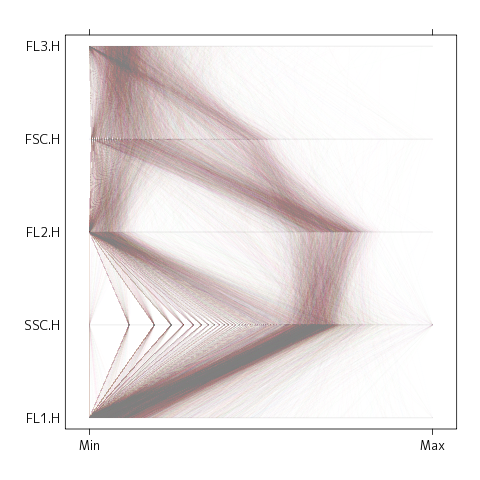
_ hypervariate な平行座標プロット
ところで,この図を png 化した時に
> data(gvhd10, package = "latticeExtra")
>  png(file = "lattice88.png")
> parallel(~ asinh(gvhd10[c(3, 2, 4, 1, 5)]), data = gvhd10,
+            subset = Days == "13", alpha = 0.01, lty = 1)
>  dev.off()
X11cairo
      2
X11cairo というメッセージを初めてみた.Cairo そのものは,アンチエイリアスを備えた二次元ベクトル・グラフィックスライブラリのことだが.
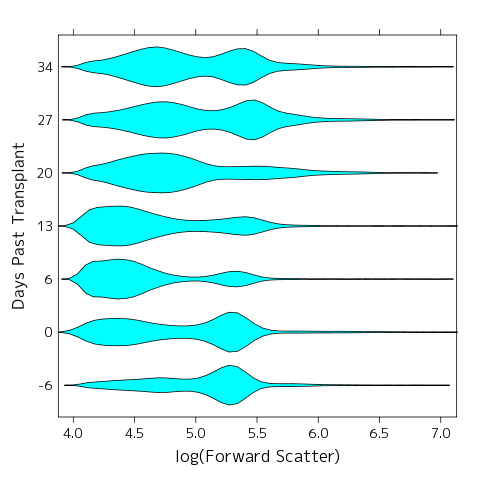
_ バイオリンプロット.
言い得て妙である.日本風なら,ひょうたんプロットかな? テキスト p.49
_ 掲載の図が R で実現できない理由
は,著者が dev.copy2eps() 関数ではなく postscript() 関数を使って作図しているからであった.postscript() 関数での作図パラメータは異なる. [#fa03bf9b]
> ?trellis.device
- 原書 p.57真ん中 (パラグラフ4.1最後)の以下のコードを使ってウィンドウに表示されるグラフは Figure4.3 ではない.
> dotplot(VADeaths, type = "o",
       pch =  1:4, col = 1:4, lty = 1:4,
         key = key.list,
         main = "Death Rates in Virginia - 1940",
         xlab = "Rate (per 1000)")
Figure4.3とまったく同じ図を作成するためには次のコードを実行する.
> key.list <- list( space = "right",
              text =  list(colnames(VADeaths)) ,
              points = list(pch = c(1,3,6,0), col = 1:4),
              lines = list(lty = 1:4, col = 1:4))
> dotplot(VADeaths,
       panel = function (...){
         panel.xyplot(...,  type = "o",
                  panel.grid = panel.grid(h=-1,v=0),
                  pch =  c(1,3,6,0), col = 1:4, lty = 1:4)
         },
         key = key.list,
         main = "Death Rates in Virginia - 1940",
         xlab = "Rate (per 1000)")
- テキスト p.41
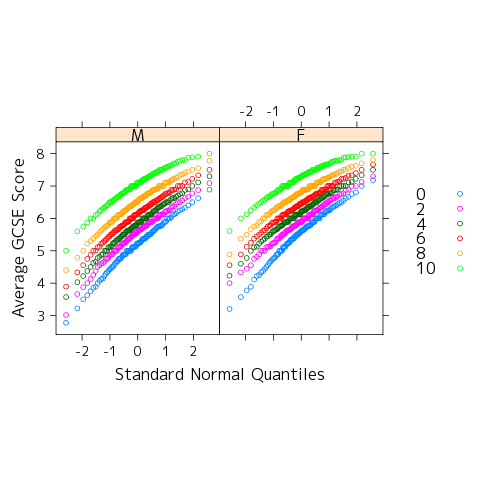
コードをそのまま実行すると次のグラフが作成される.
data(Chem97, package = "mlmRev")
qqmath(~ gcsescore | gender, Chem97,
        groups = score, aspect = "xy",
        f.value = ppoints(100),
         auto.key = list(space = "right") ,
        xlab = "Standard Normal Quantiles",
        ylab = "Average GCSE Score")
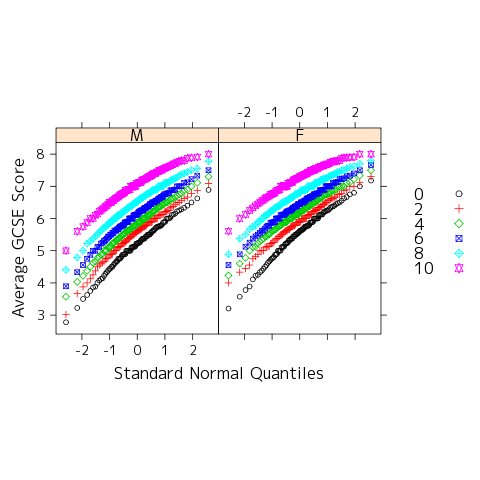
しかし,掲載されているのは次のような図(ただし白黒)
pch.col <- sort(unique(Chem97$score)) + 1

key.list <- list( space = "right",
    text =  list(as.character(pch.col-1) ) ,
     points = list(pch = pch.col, col = 1:6  ) )

qqmath(~ gcsescore | gender, Chem97,
        groups = score, aspect = "xy",
        f.value = ppoints(100),  pch = pch.col ,
        col = 1:6,    key = key.list,
        xlab = "Standard Normal Quantiles",
        ylab = "Average GCSE Score")
Baayen にも同じように,掲載コードとグラフが,R-2.8.1 で再現できない例がある.
library(languageR)
affixes.pr = prcomp(affixProductivity[,
   1:(ncol(affixProductivity)-3)])
library(lattice)
super.sym = trellis.par.get("superpose.symbol")
splom(data.frame(affixes.pr$x[,1:3]),
groups = affixProductivity$Registers,
panel  = panel.superpose,
 key    = list(
 title  = "texts in productivity space",
 text   = list(c("Religious", "Children",
 "Literary", "Other")),
points = list(pch = super.sym$pch[1:4],
col = super.sym$col[1:4])))
dim(affixes.pr$rotation)
affixes.pr$rotation[1:10, 1:3]
/key リスト points をみると,super.sym$pch[1:4] という指定があり, /これは記号をカテゴリごとに変更するつもりなのだろうが,デフォルトの/R_trellis.par.get の出力は / $pch / [1] 1 1 1 1 1 1 1 /なので,記号はすべて 1,つまり○に決まっている. / points = list(pch = super.sym$pch[1:4], /の部分を / points = list(pch = 1:4 /とすれば,テキスト記載の図になるが,これは筆者のミスなのか, /あるいは,Latticeで何か設定に変更が行われた結果なのか? /latticeの以前の設定は,どうだったのだろうか,と思って, /R-2.5.1のままになっているLinuxマシンで実行したら, /結果は上と変わらん.
