R_Lattice
Lattice Multivariate Data Visualization with R 翻訳メモ
_ グラフィックスパラメータ設定
ここを参考にする.
背景を白色にする
trellis.par.set("background", list(col = "white"))
lset(list(background = list(col = "white"))
フォントサイズを12にする
fsize <- trellis.par.get("fontsize")
fsize$default <- 12
trellis.par.set("fontsize", fsize)
lset(list(fontsize = list(default = 12)))
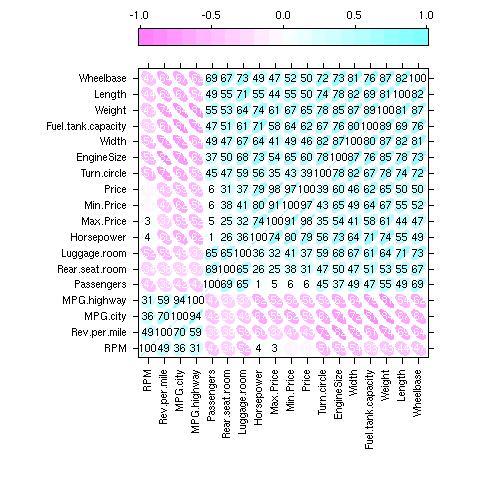
_ corrgram
コレログラムと訳されていることがあるが,この関数は,必ずしも時系列データにだけ適用されるわけではないのだが.
data(Cars93, package = "MASS")
cor.Cars93 <-
  cor(Cars93[, !sapply(Cars93, is.factor)], use = "pair")
ord <- order.dendrogram(as.dendrogram
          (hclust(dist(cor.Cars93))))
panel.corrgram <-
     function(x, y, z, subscripts, at,
              level = 0.9, label = FALSE, ...)
 {
     require("ellipse", quietly = TRUE)
     x <- as.numeric(x)[subscripts]
     y <- as.numeric(y)[subscripts]
     z <- as.numeric(z)[subscripts]
     zcol <- level.colors(z, at = at, ...)
     for (i in seq(along = z)) {
         ell <- ellipse(z[i], level = level, npoints = 50,
                  scale = c(.2, .2), centre = c(x[i], y[i]))
        panel.polygon(ell, col = zcol[i], border = zcol[i], ...)
     }
     if (label)
         panel.text(x = x, y = y, lab = 100 * round(z, 2),
          cex = 0.8, col = ifelse(z < 0, "white", "black"))
 }

levelplot(cor.Cars93[ord, ord],
            at = do.breaks(c(-1.01, 1.01), 20),
           xlab = NULL, ylab = NULL,
             colorkey = list(space = "top"),
           scales = list(x = list(rot = 90)),
           panel = panel.corrgram, label = TRUE)
_ 散布図行列でデータを特定の観測値をハイライト
env <- environmental
env$ozone <- env$ozone^(1/3)
splom(env, pscales = 0, col = "grey")
trellis.focus("panel", 1, 1, highlight = FALSE)
panel.link.splom(pch = 16, col = "black")
trellis.unfocus()
_ lattice で対話的に凡例を追加
data(Chem97, package = "mlmRev")
qqmath(~ gcsescore | factor(score), Chem97, groups = gender,
  f.value = function(n) ppoints(100),
  aspect = "xy",
  page = function(n) {
   cat("Click on plot to place legend", fill = TRUE)
   ll <- grid.locator(unit = "npc")
   if (!is.null(ll))
     draw.key(simpleKey(levels(factor(Chem97$gender))),
               vp = viewport(x = ll$x, y = ll$y),
               draw = TRUE)
        })
_ grid は Load されない?
> demo("labels", package = "lattice")
が動かない.
以下にエラー do.call("trellis.skeleton", c(list(formula = formula,
     cond = cond,  :
  関数 "textGrob" を見つけることができませんでした
gridパッケージで定義されている textGrob にアクセスできない. わざわざ
> library(gird)
と実行するか,あるいは
> file.show(system.file("demo/labels.R", package = "lattice"))
の
qq(gl(2, 100) ~ c(runif(100, min = -2, max = 2), rnorm(100)),
   xlab =
   textGrob(rep("Uniform", 2),
            x = unit(.5, "npc") + unit(c(.5, 0), "mm"),
            y = unit(.5, "npc") + unit(c(0, .5), "mm"),
            gp = gpar(col = c("black", "red"), cex = 3)),
   ylab =
   textGrob(rep("Normal", 2), rot = 90,
            x = unit(.5, "npc") + unit(c(.5, 0), "mm"),
            y = unit(.5, "npc") + unit(c(0, .5), "mm"),
            gp = gpar(col = c("black", "red"), cex = 3)),
   main = "Q-Q plot")
の textGrob,unit,gpar に grid:: を冠する必要がある. 確認すると
> search()
[1] ".GlobalEnv"        "package:stats"     "package:graphics"
[4] "package:grDevices" "package:utils"   "package:datasets"
[7] "package:methods"   "Autoloads"       "package:base"
> sessionInfo()
R version 2.8.1 (2008-12-22)
i686-pc-linux-gnu

attached base packages:
[1] stats  graphics  grDevices utils  datasets  methods  base
> library(lattice)
> sessionInfo()
R version 2.8.1 (2008-12-22)
i686-pc-linux-gnu
...
attached base packages:
[1] stats  graphics  grDevices utils  datasets  methods  base

other attached packages:
[1] lattice_0.17-17

loaded via a namespace (and not attached):
[1] grid_2.8.1
> search()
 [1] ".GlobalEnv"        "package:lattice"   "package:stats"
 [4] "package:graphics"  "package:grDevices" "package:utils"
 [7] "package:datasets"  "package:methods"   "Autoloads"
[10] "package:base"
と表示され,ロードはされているが,アタッチはされていない.
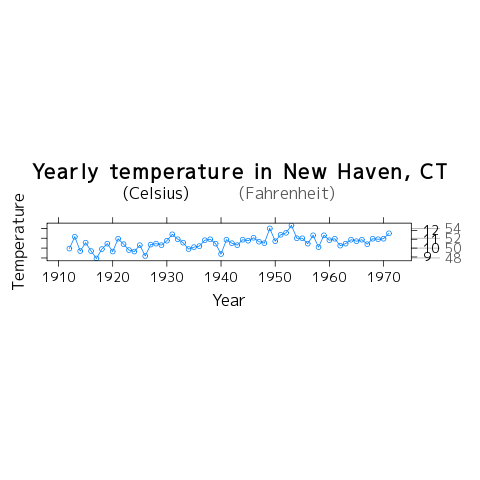
_ 異なる尺度を一つの軸に描くテクニック.
> axis.CF <- function(side, ...) {
   if (side == "right") {
       F2C <- function(f) 5 * (f - 32) / 9
       C2F <- function(c) 32 + 9 * c / 5
       ylim <- current.panel.limits()$ylim
       prettyF <- pretty(ylim)
       prettyC <- pretty(F2C(ylim))
       panel.axis(side = side, outside = TRUE, at = prettyF,
             tck = 5, line.col = "grey65", text.col = "grey35")
       panel.axis(side = side, outside = TRUE, at = C2F(prettyC),
                  labels = as.character(prettyC),
               tck = 1, line.col = "black", text.col = "black")
     }
     else axis.default(side = side, ...)
 }
> xyplot(nhtemp ~ time(nhtemp), aspect = "xy", type = "o",
      scales = list(y = list(alternating = 2, tck = c(1, 5))),
      axis = axis.CF, xlab = "Year", ylab = "Temperature",
      main = "Yearly temperature in New Haven, CT",
      key = list(text = list(c("(Celsius)", "(Fahrenheit)"),
                 col = c("black", "grey35")), columns = 2))
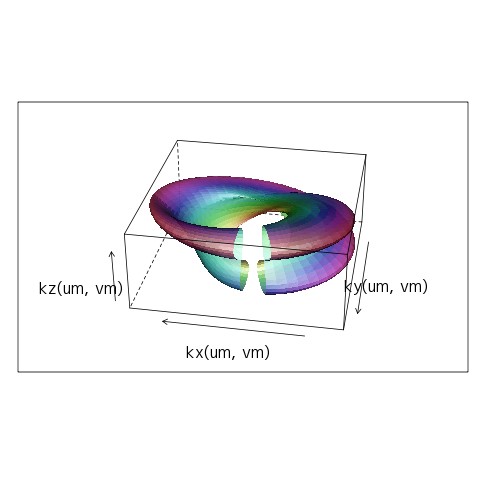
_ クラインの壺
kx <- function(u, v)
     cos(u) * (r + cos(u/2) * sin(t*v) - sin(u/2) * sin(2*t*v))
ky <- function(u, v)
     sin(u) * (r + cos(u/2) * sin(t*v) - sin(u/2) * sin(2*t*v))
kz <- function(u, v)
     sin(u/2) * sin(t*v) + cos(u/2) * sin(t*v)
n <- 50
u <- seq(0.3, 1.25, length = n) * 2 * pi
v <- seq(0, 1, length = n) * 2 * pi
um <- matrix(u, length(u), length(u))
vm <- matrix(v, length(v), length(v), byrow = TRUE)
r <- 2
t <- 1

wireframe(kz(um, vm) ~ kx(um, vm) + ky(um, vm),
    shade = TRUE, screen = list(z = 170, x = -60),
     alpha = 0.75, panel.aspect = 0.6, aspect = c(1, 0.4))
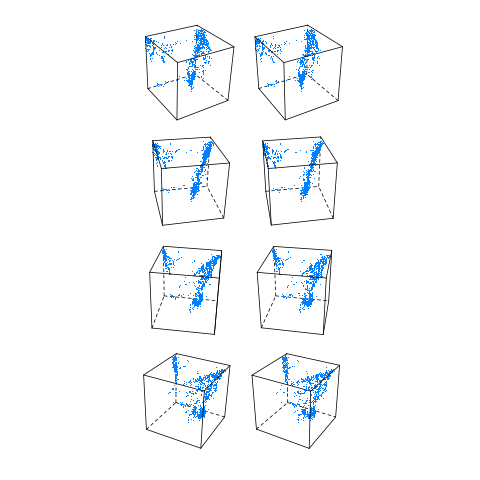
_ 立体画像?
ページの向こうに焦点を合わせるようにして,二つの列を重ね合わせると,奥行きが表現された画像を実感することができる?
_ cloud() 関数のデフォルト
の viewpoint. screen 引数にリストで指定する.
> cloud(iris[,1] ~ iris[,2] * iris[,3])
> X11()
> cloud(iris[,1] ~ iris[,2] * iris[,3],
    screen = list(z = 40, y = 0, x = -60),
     )
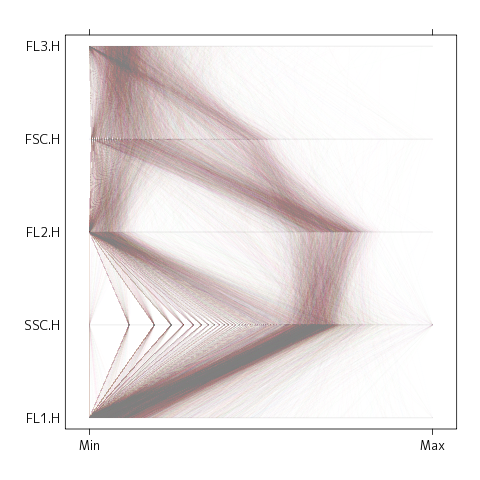
_ hypervariate な平行座標プロット
ところで,この図を png 化した時に
> data(gvhd10, package = "latticeExtra")
>  png(file = "lattice88.png")
> parallel(~ asinh(gvhd10[c(3, 2, 4, 1, 5)]), data = gvhd10,
+            subset = Days == "13", alpha = 0.01, lty = 1)
>  dev.off()
X11cairo
      2
X11cairo というメッセージを初めてみた.Cairo そのものは,アンチエイリアスを備えた二次元ベクトル・グラフィックスライブラリのことだが.
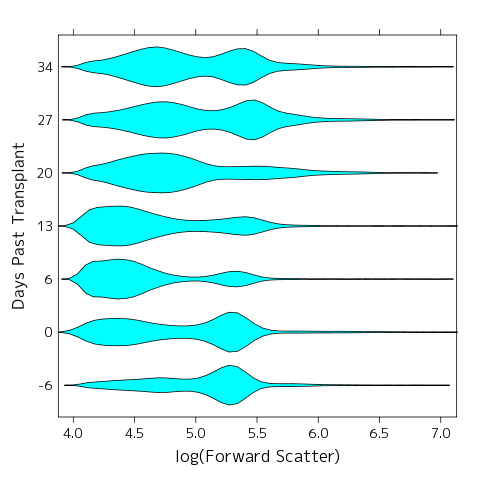
_ バイオリンプロット.
言い得て妙である.日本風なら,ひょうたんプロットかな? テキスト p.49
_ 掲載の図が R で実現できない理由
は,著者が dev.copy2eps() 関数ではなく postscript() 関数を使って作図しているからであった.postscript() 関数での作図パラメータは異なる.
> ?trellis.device
X11などのウィンドウで同じ出力を得るにはあらかじめ以下を実行して, trellis.device(theme = col.whitebg())} を実行し,テーマを lattice.theme にしておく.以下は R-help からの引用.
Re: [R] lattice default theme
From: Deepayan Sarkar (deepayan@stat.wisc.edu)
Date: Fri 10 Jan 2003 - 03:55:00 EST
* In reply to: apjaworski@mmm.com: "[R] lattice default theme"
Message-id: <200301091055.00194.deepayan@stat.wisc.edu>

On Wednesday 08 January 2003 11:27 am, apjaworski@mmm.com wrote:
> I have a feeling that this was already discussed here, but I
  cannot
> remember the outcome of the discussion.
>
> I would like to have the col.whitebg theme as a default and I
 cannot figure
> out how to do it. Functions like lset or trellis.par.set
require that the
> device be active, so how does one set a different default
 for all
> invocations of trellis.device?

No good way that I can think of, other than replacing all
calls to trellis.device() by
trellis.device(theme = col.whitebg()).

A hack is perhaps possible, which involves the global variable
lattice.theme, which stores the settings. If you have that
variable in your global environment (as part of your saved
workspace, for example) with components
for all the devices you want to use, lattice will use it.
This  will work if you start devices with x11(), postscript()
etc. Unfortunately,
any call to trellis.device() to start a new device will overwrite
this unless retain = TRUE is specified. This includes the default
invocation when print.trellis is called without any device open.

Deepayan
- 原書 p.57真ん中 (パラグラフ4.1最後)の以下のコードを使ってウィンドウに表示されるグラフは Figure4.3 ではない.
> dotplot(VADeaths, type = "o",
       pch =  1:4, col = 1:4, lty = 1:4,
         key = key.list,
         main = "Death Rates in Virginia - 1940",
         xlab = "Rate (per 1000)")
Figure4.3とまったく同じ図を作成するためには次のコードを実行する.
> key.list <- list( space = "right",
              text =  list(colnames(VADeaths)) ,
              points = list(pch = c(1,3,6,0), col = 1:4),
              lines = list(lty = 1:4, col = 1:4))
> dotplot(VADeaths,
       panel = function (...){
         panel.xyplot(...,  type = "o",
                  panel.grid = panel.grid(h=-1,v=0),
                  pch =  c(1,3,6,0), col = 1:4, lty = 1:4)
         },
         key = key.list,
         main = "Death Rates in Virginia - 1940",
         xlab = "Rate (per 1000)")
- テキスト p.41
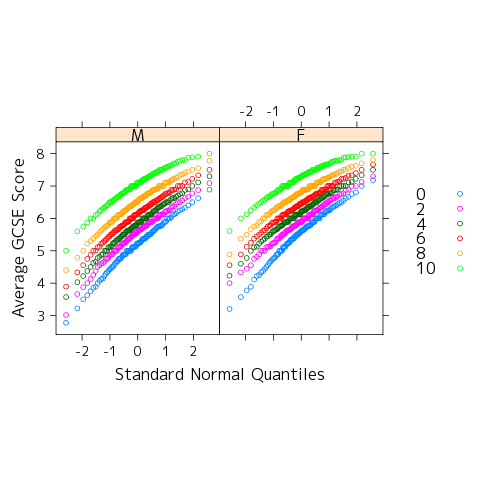
コードをそのまま実行すると次のグラフが作成される.
data(Chem97, package = "mlmRev")
qqmath(~ gcsescore | gender, Chem97,
        groups = score, aspect = "xy",
        f.value = ppoints(100),
         auto.key = list(space = "right") ,
        xlab = "Standard Normal Quantiles",
        ylab = "Average GCSE Score")
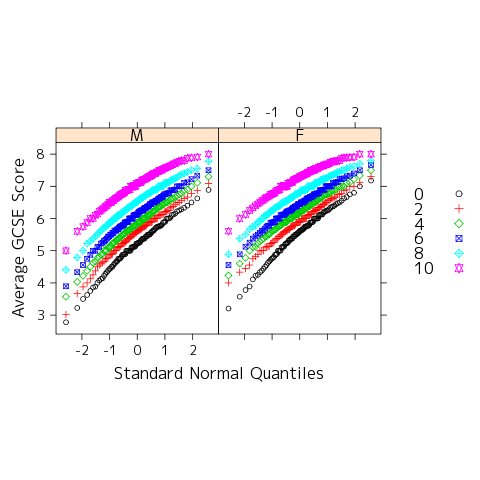
しかし,掲載されているのは次のような図(ただし白黒)
pch.col <- sort(unique(Chem97$score)) + 1

key.list <- list( space = "right",
    text =  list(as.character(pch.col-1) ) ,
     points = list(pch = pch.col, col = 1:6  ) )

qqmath(~ gcsescore | gender, Chem97,
        groups = score, aspect = "xy",
        f.value = ppoints(100),  pch = pch.col ,
        col = 1:6,    key = key.list,
        xlab = "Standard Normal Quantiles",
        ylab = "Average GCSE Score")
Baayen にも同じように,掲載コードとグラフが,R-2.8.1 で再現できない例がある.
library(languageR)
affixes.pr = prcomp(affixProductivity[,
   1:(ncol(affixProductivity)-3)])
library(lattice)
super.sym = trellis.par.get("superpose.symbol")
splom(data.frame(affixes.pr$x[,1:3]),
groups = affixProductivity$Registers,
panel  = panel.superpose,
 key    = list(
 title  = "texts in productivity space",
 text   = list(c("Religious", "Children",
 "Literary", "Other")),
points = list(pch = super.sym$pch[1:4],
col = super.sym$col[1:4])))
dim(affixes.pr$rotation)
affixes.pr$rotation[1:10, 1:3]
/key リスト points をみると,super.sym$pch[1:4] という指定があり, /これは記号をカテゴリごとに変更するつもりなのだろうが,デフォルトの/R_trellis.par.get の出力は / $pch / [1] 1 1 1 1 1 1 1 /なので,記号はすべて 1,つまり○に決まっている. / points = list(pch = super.sym$pch[1:4], /の部分を / points = list(pch = 1:4 /とすれば,テキスト記載の図になるが,これは筆者のミスなのか, /あるいは,Latticeで何か設定に変更が行われた結果なのか? /latticeの以前の設定は,どうだったのだろうか,と思って, /R-2.5.1のままになっているLinuxマシンで実行したら, /結果は上と変わらん.
