R_Lattice のバックアップ(No.2)
- バックアップ一覧
- 差分 を表示
- 現在との差分 を表示
- ソース を表示
- R_Lattice へ行く。
- 1 (2008-12-27 (土) 13:20:28)
- 2 (2008-12-27 (土) 13:30:43)
- 3 (2008-12-27 (土) 18:08:54)
- 4 (2008-12-30 (火) 16:12:02)
- 5 (2009-01-10 (土) 12:49:01)
- 6 (2009-01-10 (土) 18:17:20)
- 7 (2009-01-16 (金) 15:41:47)
- 8 (2009-01-17 (土) 15:58:41)
- 9 (2009-01-23 (金) 14:25:09)
- 10 (2009-01-29 (木) 18:05:34)
- 11 (2009-01-31 (土) 14:00:12)
- 12 (2009-02-05 (木) 18:17:47)
- 13 (2009-02-05 (木) 18:24:33)
- 14 (2009-02-09 (月) 16:34:56)
- 15 (2009-02-20 (金) 15:10:37)
- 16 (2009-02-20 (金) 18:28:13)
- 17 (2009-02-21 (土) 15:36:08)
- 18 (2009-05-25 (月) 12:49:19)
Lattice 翻訳メモ
- テキスト p.41
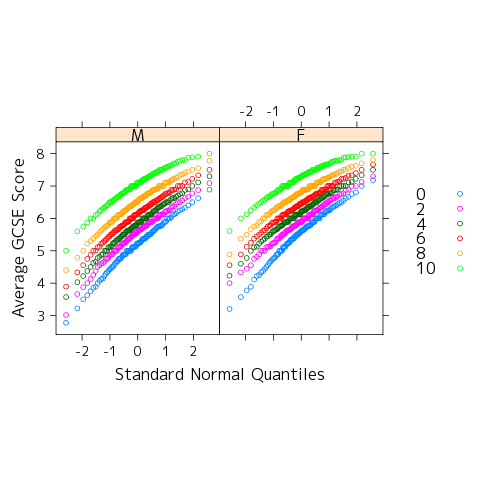
コードをそのまま実行すると次のグラフが作成される.
data(Chem97, package = "mlmRev")
qqmath(~ gcsescore | gender, Chem97,
        groups = score, aspect = "xy",
        f.value = ppoints(100),
        auto.key = list(space = "right") ,
        xlab = "Standard Normal Quantiles",
        ylab = "Average GCSE Score")
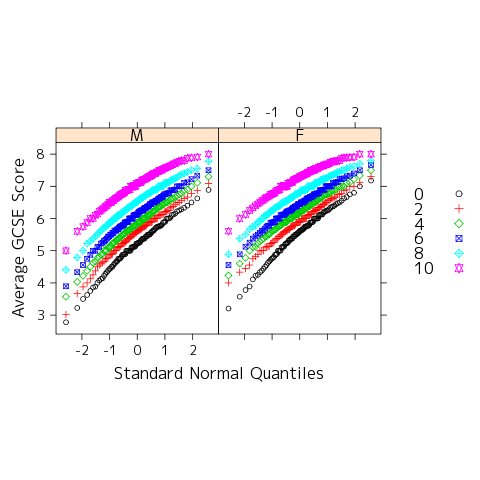
しかし,掲載されているのは次のような図(ただし白黒)
pch.col <- sort(unique(Chem97$score)) + 1

key.list <- list( space = "right",
    text =  list(as.character(pch.col-1) ) ,
     points = list(pch = pch.col, col = 1:6  ) )

qqmath(~ gcsescore | gender, Chem97,
        groups = score, aspect = "xy",
        f.value = ppoints(100),  pch = pch.col ,
        col = 1:6,    key = key.list,
        xlab = "Standard Normal Quantiles",
        ylab = "Average GCSE Score")

