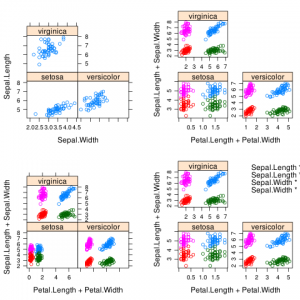
Rの lattice パッケージで作図する場合
par (mfrow=c(2,2))
を指定しても,パネルを4枚並べることはできません.
代わりに以下のようにします.
# 四つのプロットをオブジェクト化し、最後に一枚のプロットにパネルとして並べる

 # 品種ごとに

(xy1 <- xyplot (Sepal.Length ~ Sepal.Width | Species,  data = iris))

 # 複数の変数を各プロットで描く
(xy2 <- xyplot (Sepal.Length + Sepal.Width ~ Petal.Length + Petal.Width | Species,
                data = iris))

 # スケールをパネルごとに変更
(xy3 <- xyplot (Sepal.Length + Sepal.Width ~ Petal.Length + Petal.Width | Species,
                scales = "free",  data = iris))

 # 凡例を追加
(xy4 <- xyplot (Sepal.Length + Sepal.Width ~ Petal.Length + Petal.Width | Species,
                scales = "free", auto.key = list(x = .6, y = .7, corner = c(0, 0)),
                layout = c(2, 2), data = iris))

# この「print」関数は「print.trellis」を呼び出す
print (xy1, split = c(1,1,2,2), more = TRUE) # 2行2列のグリッドの1行目の1列目に描画
print (xy2, split = c(1,2,2,2), more = TRUE)
print (xy3, split = c(2,1,2,2), more = TRUE)
print (xy4, split = c(2,2,2,2), more = TRUE)

